Today we will face the basic concepts of finance. They are not too much difficult, we need some basic maths and a little bit of statistics.
#1: Return
Here are two prices for stock A:
We can calculate the **Stock A’s return = (**101−100)/100 = 1% in one month.
And if we have more months?
The average monthly returns over 3 months are: Stock A: (115.27/100)^(1/3) = 5%
Stock B: (118.72/100)^(1/3) = 6%
Ok, so now we know how to compute a return over a period of time, but if you take a look on the last table we recognize that the entirety of the historical performance of an asset must be taken into account in investment decisions and not just the most recent observation(s).
Remember past performance is not indicative of future results.
But, past performances, as every data, can tell us something more if we know how to read them, we will come in the future. Information is the key to success in financial markets.
#2: Volatility and risk-free assets
Take a look on these shares and calculate the returns
Yes!, they are both 5%.
If we can reasonably expect Stock B to continue to deliver a 5% monthly return in the future, it is said to be “risk-free”. A risk-free asset is an asset whose future returns are certain.
The volatility is the variation between the monthly, in this case, return and the average return of the asset. You have to ask more volatility only if there is more return, in the other case for equal return is better choose a less volatile product.
If we haven’t a way to compare directly return or volatility because they are different, we can use the average return over risk (volatility).
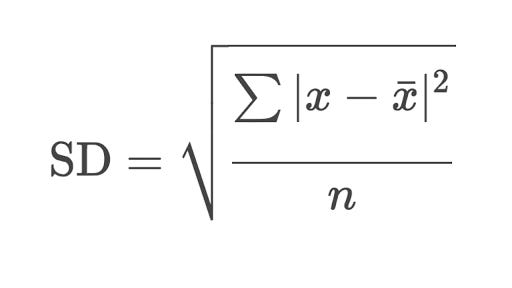
The volatility can be found using this formula:
Nothing of strange, for the ones that know it, this is the Standard Deviation Formula, for the others the idea behind the formula is to help us to identify on average how the numbers are distant from the mean.
So take the first stock, we have ((6.88^2+5.78^2+7.88^2)/3)^(1/2)=6.9.
On average numbers are distant 6.9 from the mean.
And the second Stock volatility?
Yes! it’s 0!
So the A return/risk is something around 0.72 (it’s good, it’s difficult have always a return/risk equal to 1, but we try to reach it).
The B’return/risk is infinite 😳, yeah 😅, a number divided by 0 tends to infinite, so B is the best choice.
In reality a very risk-free product doesn’t exist because every debtor has a default risk associated, but some products can be considered risk-free as well.
#3: Distribution of volatility
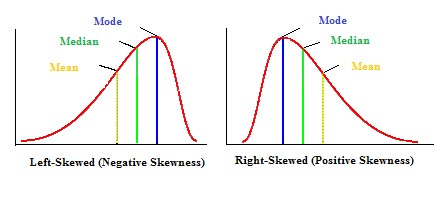
In previous point, we saw volatility, but we calculated average volatility. Not all the instruments with the same volatility are equally risky.
To understand the difference we can make an example
As you can see in photo, I know it’s difficult because it is similar to an optical illusion, the two graphs have the same mean, but the probability you can have a return above the mean is greater in the left distribution.
#4: Simple vs Compound interest
Compound interest is very powerful and useful, because it can help you to increase your wealth with low efforts, you need only time and patience.
How it works?
Suppose you have invested 100€ at 3% rate last year and today you receive 3€
If you reinvest everything at the same interest rate, next year you will receive 106,09 = 1001,03 + 31,03.
If with relatively low interest rate is not so “magic” and it’s difficult to create the 😮 effect, think that with an interest rate of 10% you will double the initial amount in less than 8 years, while with the simple interest you need 10 years. You save 2 years of your life 😁, Not Bad!
If you want to calculate the Compound interest you can use the formula:
#5: Bull and Bear market
Easy concepts when the markets are going up and people are confident that the market can go up again then we are in a bull market, otherwise if the market goes down and everyone fears it will fall again then we are in a bear market. Why these names?
Bulls attack bottom up
Bears from the top to bottom
#6: Diversification
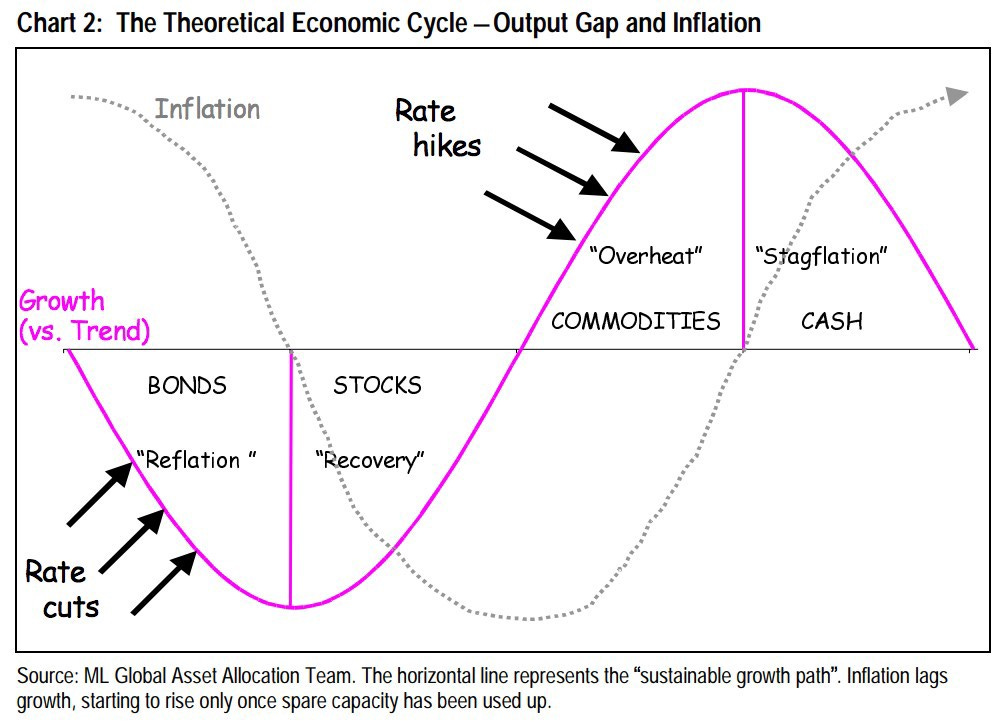
We have already said something about diversification, but not why it is important and why may row against your investments.
Why Diversify?
Because not all the asset class answer equally to the the different economic environment. We will talk more in another post, but you just need to know for the moment what is shown in the photo below
Naturally not all the asset class of the same category react equally to the environments (for example difensive industries perform better when the economy have some problems to grow.
Diversify give you the possibility to cushion the blow or even make money when it is a bear market.
Why not Diversify too much?
When you have too much eggs in your basket you cannot follow all them, it’s difficult knowing when to buy a stock, but it’s more difficult to know when to sell it! 🧐 Oh yes! Trust me. Often people buy good and sell wrong, it’s less usual the opposite. During a bear market people tend to disinvest all that they own, because they have fear that the the collapse brings them down with the others and they spend less time to analyze the firms in their portfolio.
Another reason is that in an economy the companies that really create value are few, those companies that have that little bit more are not all the companies of an economy. Suffice it to say that due to the way the S&P 500 is composed, it is often only 100 companies that determine price fluctuations. You need to invest only those 100 and not all American companies…
We can now continue our journey with these basic finance concepts.
Bonus link:


