

When you invest your money, there are really only two questions you should care about:
✅ How much did I earn (or lose)?
✅ How much risk am I taking to earn that return?
Sounds simple, but in practice, understanding your investment performance is more complicated. In this article, I’ll walk you through the basics of how return and risk are measured — in plain English, no finance degree required.
1️⃣ What Is the Return on an Investment?
The return tells you whether your investment has made or lost money over a certain period — usually expressed as a percentage.
A Simple Example:
You invest €100
After one year, your investment is worth €120
Your return is:
👉 (120 - 100) / 100 = 20%
So, you earned a 20% return.
Important: Don’t confuse return with interest rate. The interest rate is usually known upfront (especially for savings accounts), while your investment return is only known after the fact.
2️⃣ Two Ways to Calculate Return: TWRR and MWRR
TWRR – Time-Weighted Rate of Return
This method measures how your investment performs over time, ignoring any money you add or withdraw during the period. It’s perfect for comparing fund managers’ performance because it reflects only the market return, not your individual cash flows.
👉 Example: You invest €100, make no additional deposits, and after one year, your investment is worth €120. The return is 20%, simple as that.
MWRR – Money-Weighted Rate of Return
This approach takes into account all the cash flows (deposits and withdrawals) during the investment period. It shows your actual return based on the money you invested and when you invested it.
If you added €1,000 halfway through the year, your return calculation must reflect that. The MWRR does exactly that — giving more weight to larger amounts invested for longer periods.
For individual investors, the MWRR is often the most relevant measure of real performance.
3️⃣ The Magic of Compound Interest
Here’s where things get exciting: returns can generate more returns. This is the power of compound interest.
Each year, your gains are added to your original capital. In the following year, you earn returns not only on your initial investment but also on your previous profits.
The result? If your annual return stays positive over time, your investment grows exponentially.
👉 But there’s a catch:
You need time — often decades
You need to accept some level of risk — safe investments usually don’t generate life-changing growth
4️⃣ What Is Investment Risk?
Risk is the uncertainty around your investment results. To put it simply:
If you know exactly how much you’ll earn — no risk
If you don’t — there’s risk involved
For example, putting your money in a government-backed savings account is low-risk, but the returns are minimal.
Risk Aversion
Humans generally dislike risk. Given the same expected return, most of us would choose the safer option. But if someone offers higher potential returns, many are willing to accept greater risk.
That’s the basic trade-off in finance: higher returns come with higher risk.
5️⃣ How Do We Measure Risk?
There are several ways, but two are the most common:
Standard Deviation (Volatility)
This measures how much your investment returns vary around the average. Higher volatility means your investment is more unpredictable — in other words, riskier.
👉 Example:
Investment A — average return 5%, volatility 2% → stable
Investment B — average return 5%, volatility 10% → much more unstable
More volatility = more risk.
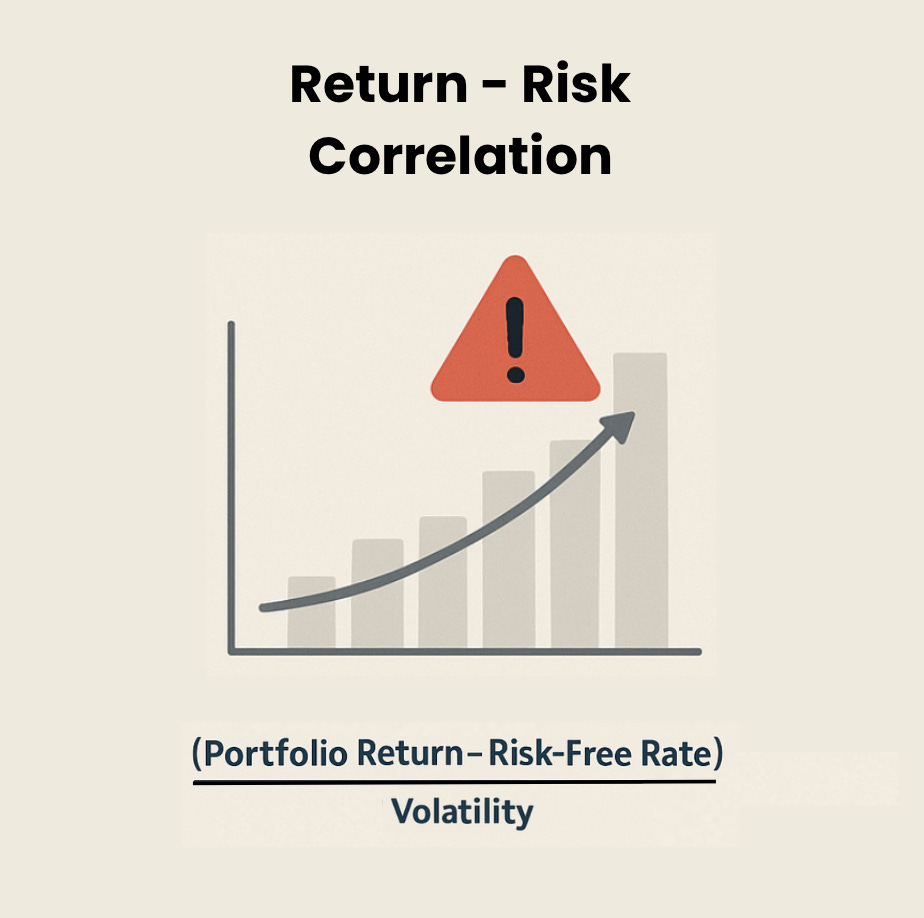
6️⃣ Is the Risk Worth It? The Sharpe Ratio
The Sharpe Ratio helps you compare how much return you get for each unit of risk you take.
Here’s the simplified formula:
(Portfolio Return - Risk-Free Rate) / Volatility
The higher the Sharpe Ratio, the better — it means you’re earning more return for the risk you’re taking.
But be careful: the Sharpe Ratio can be misleading when returns are negative. In tough market conditions, it’s not always the best tool for decision-making.
7️⃣ VaR and CVaR: Understanding Worst-Case Scenarios
Two key tools help estimate how much you could lose in bad situations:
VaR (Value at Risk): Shows the maximum expected loss with a given level of confidence.
Example: “There’s a 95% chance you won’t lose more than €300 in the next month.”
CVaR (Conditional Value at Risk): Goes a step further, estimating the average loss if things go worse than your VaR threshold.
👉 If your VaR says you won’t lose more than €300 in 95% of cases, your CVaR might tell you that in the worst 5% of scenarios, your average loss could be €600.
These tools don’t predict the absolute worst possible loss — extreme scenarios can still happen — but they help quantify your downside risk realistically.
Simple Takeaways
Measuring return tells you how well your investment performed
Measuring risk tells you how much uncertainty you faced to get that return
Compound interest is your best friend for long-term growth — but it requires time and risk tolerance
VaR and CVaR help you estimate potential losses and prepare for tough markets
Remember: Every investment is a balance between how much you want to earn and how much risk you’re willing to take. There’s no “perfect” investment — only more informed decisions.