

In the world of finance, particularly when it comes to investing, analysts and investors have long sought to uncover the mysteries of market behavior and the financial instruments that populate it. The ultimate goal is often to predict price movements with precision, capitalizing on this information to achieve returns that exceed the market average.
To navigate this complexity, three primary types of analysis are commonly employed: fundamental analysis, technical analysis, and quantitative analysis. Each of these approaches offers a unique lens through which to evaluate financial instruments, providing distinct insights into market dynamics and investment potential.
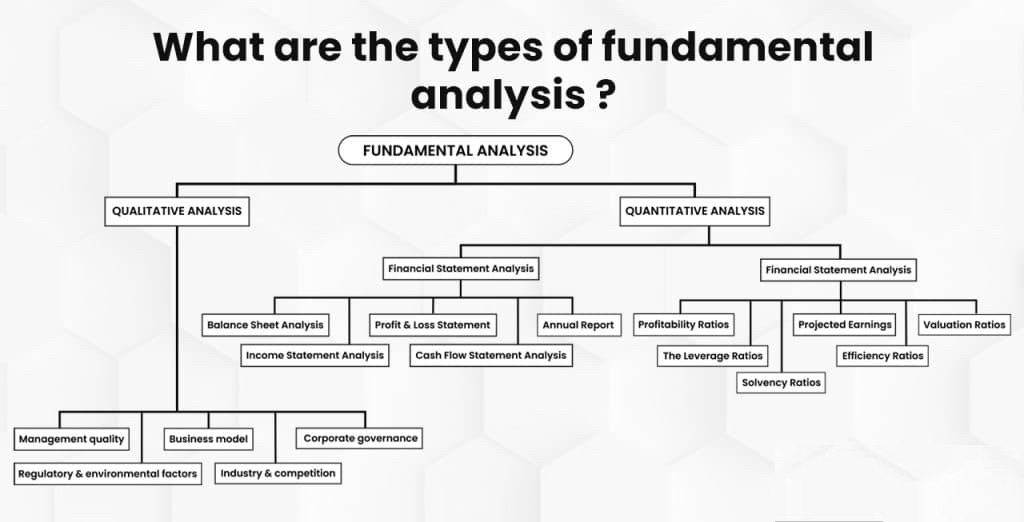
Fundamental Analysis
At its core, fundamental analysis is about predicting the future performance of a financial instrument by examining a wide range of economic variables. This analysis operates on both macro and micro levels.
On a macroeconomic scale, fundamental analysis looks at broader economic indicators, such as:
• Gross Domestic Product (GDP): Reflecting the overall health and growth of an economy.
• Inflation Rates: A key indicator of purchasing power and economic stability.
• Unemployment Rates: A measure of economic vitality and consumer confidence.
• Industrial Production: Highlighting the output of industries as a gauge of economic activity.
On a microeconomic level, fundamental analysis shifts focus to individual companies or sectors. Analysts delve into the financial health and future profitability of companies by studying financial statements, key ratios, and industry trends. Commonly analyzed metrics include:
• Return on Equity (ROE): A measure of profitability relative to shareholders’ equity.
• Return on Assets (ROA): Indicating how efficiently a company utilizes its assets to generate profit.
• Price-to-Earnings (P/E) Ratio: Helping to determine if a stock is undervalued or overvalued.
• Liquidity Ratios: Assessing a company’s ability to cover its short-term obligations.
By combining these data points with an understanding of monetary and fiscal policies, analysts form hypotheses regarding an asset’s intrinsic value and compare it with market prices. This comparison often yields buy or sell signals based on whether the asset is undervalued or overvalued relative to its potential.
However, fundamental analysis comes with challenges. One of the most significant is the inconsistency in how companies within the same sector may account for certain financial elements. For example, some companies may adopt aggressive accounting practices, while others may be more conservative. Thus, standardizing comparisons to ensure consistency is essential for accurate conclusions.
Fundamental analysis also includes qualitative analysis (evaluating factors like management quality and brand reputation) and quantitative analysis (focusing on numerical data like earnings and cash flows). Together, these methods allow investors to gain a comprehensive view of an asset’s potential.
Technical Analysis
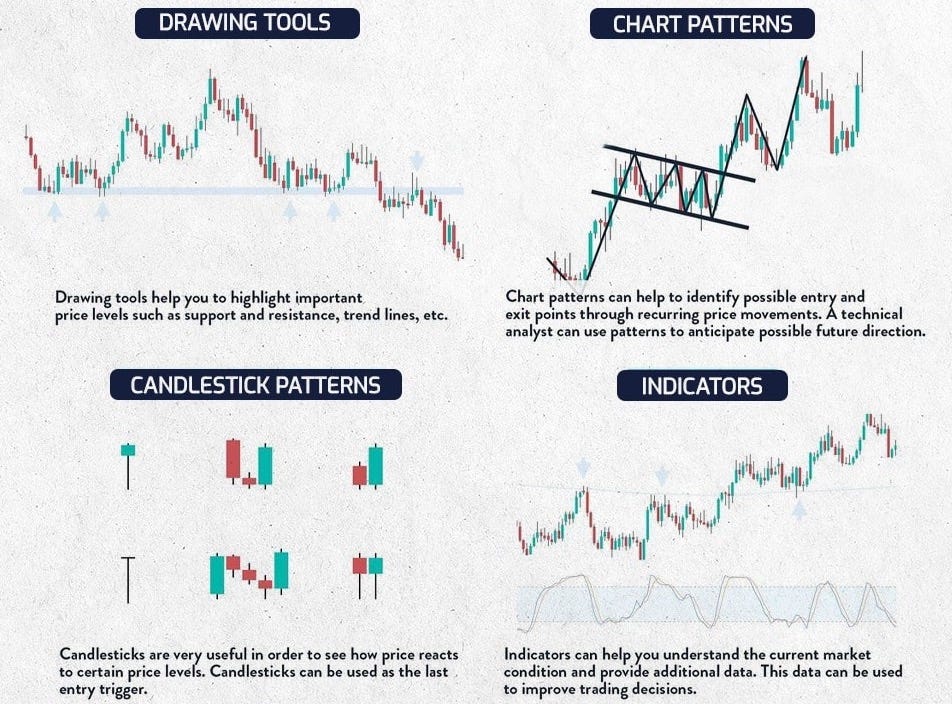
Technical analysis, in contrast, is based on the idea that market prices are influenced by historical price movements and trading volumes. By analyzing these movements through charts, technical analysts attempt to predict future price trends, operating on the principle that “history repeats itself.”
Technical analysis involves identifying patterns in historical price and volume data, assuming that certain patterns will recur. These patterns help analysts forecast price movements and identify key market turning points, such as highs, lows, and reversals.
Some of the most commonly used tools in technical analysis include:
• Support and Resistance Levels: Marking price levels where a stock tends to reverse direction.
• Head and Shoulders: A pattern indicating potential reversal points.
• Triangles, Rectangles, Flags, and Pennants: Patterns that suggest potential future price movement directions.
Additionally, technical analysts rely on indicators and oscillators like:
• Moving Averages: Smoothing out price data to identify trends.
• Relative Strength Index (RSI): Measuring the strength of a price move.
• Moving Average Convergence Divergence (MACD): A trend-following momentum indicator.
While technical analysis relies heavily on historical data to predict future movements, its effectiveness is debated. A common critique is that if certain patterns were consistently profitable, the market would quickly adjust, eliminating any potential advantages—turning them into arbitrage opportunities.
Moreover, technical analysis contributes to the efficiency of the market by helping traders identify and act on market inefficiencies, but it does not guarantee consistently superior returns. It may, however, offer profit opportunities when price inefficiencies temporarily arise.
Quantitative Analysis
Quantitative analysis takes a more mathematical and statistical approach to evaluating financial instruments. Unlike technical analysis, which relies on chart patterns, and fundamental analysis, which focuses on economic data, quantitative analysis uses advanced mathematical models and algorithms to assess investment opportunities.
Key techniques within quantitative analysis include:
• Statistical Models: Such as linear regression and probability theory, used to forecast asset returns.
• Optimization Techniques: Including linear programming and multi-objective optimization, employed to build portfolios that balance risk and return.
• Machine Learning and Artificial Intelligence (AI): These technologies are increasingly being applied to develop algorithmic trading strategies and predictive models. For instance, neural networks may be used to identify complex patterns in data and predict future market movements.
Quantitative analysis is also integral to risk management, with tools like Value at Risk (VaR) helping to quantify potential losses in an investment portfolio.
However, one critique of modern quantitative research, particularly from academics like Prof. Marcos Lopez de Prado, is that many techniques, such as multiple regression, often rely on correlations rather than causal relationships. This issue raises concerns about the long-term effectiveness of some strategies, such as factor investing.
Conclusion
In summary, understanding fundamental, technical, and quantitative analysis provides investors with a broad toolkit to assess financial markets and make informed decisions. Each approach offers distinct perspectives:
• Fundamental analysis helps assess the underlying value of an asset based on economic and financial indicators.
• Technical analysis identifies trends and market patterns that can provide insights into future price movements.
• Quantitative analysis leverages advanced mathematical models and algorithms to make predictions and optimize investment portfolios.
While each method has its strengths, it’s crucial to recognize their limitations and adapt them to the evolving landscape of financial markets. By blending elements from all three approaches, and leveraging technological advancements, investors can enhance their decision-making processes and strive toward achieving their financial objectives.